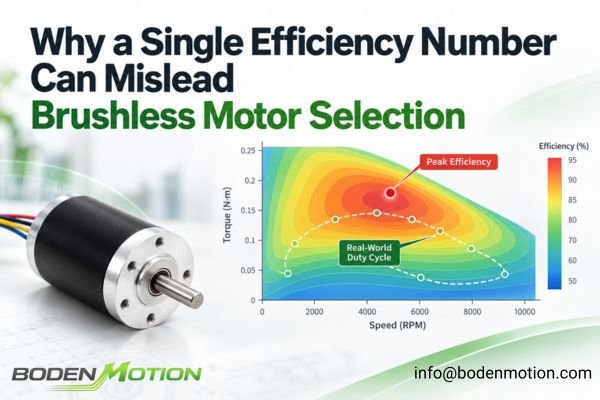
A brushless motor datasheet might advertise a peak efficiency of 85% or 90%. While this is a useful performance indicator at a specific operating point, relying on it alone for selection can lead to poor system performance, thermal issues, and shorter battery life.
Peak efficiency is a single point on a map; a real-world application is a duty cycle that moves across that map. A brushless DC motor may operate through acceleration, light-load running, steady-state operation, and high-torque peaks, each with different efficiency levels. The more useful engineering question is therefore not simply, “Which motor has the highest peak efficiency?” but “Which motor performs most efficiently across the application's actual duty cycle?”
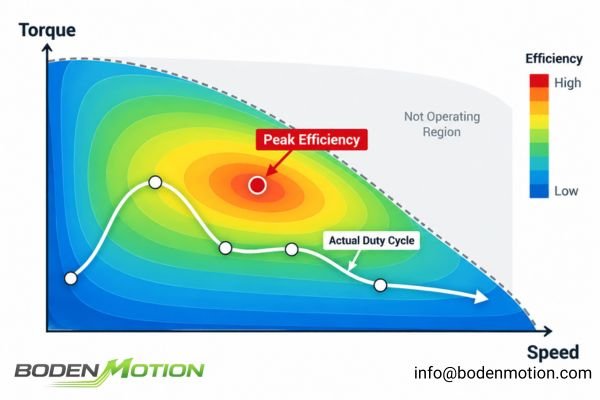
The difference matters because the published peak value describes only one operating condition, while the energy use and thermal behavior of the application are determined by the full operating profile.
What Does a Brushless Motor Efficiency Number Actually Mean?
At its core, efficiency (η) is the ratio of mechanical power delivered by the motor shaft to the electrical power consumed, expressed as η = Mechanical Output Power (P_mech) / Electrical Input Power (P_elec). The calculation itself is straightforward, but the resulting percentage only describes performance under the conditions used for that measurement.
The same efficiency percentage can mean different things depending on where electrical input power is measured and which losses are included in the calculation.
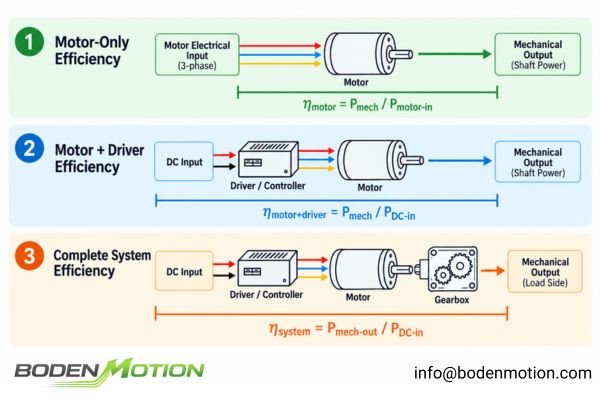
This measurement boundary determines whether the published value represents only the motor, the motor together with its electronic drive, or a broader system that includes additional mechanical and electrical components.
A datasheet efficiency figure can therefore represent different system levels:
- Motor-Only Efficiency: Measures the power entering the motor phases versus the mechanical output. This isolates the motor's performance but ignores driver losses.
- Motor + Driver Efficiency: Measures the power from the DC bus input versus the mechanical output. This gives a more realistic motor-drive system view because it includes losses from the electronics controlling the motor.
- Complete System Efficiency: May also account for losses from gearboxes, power converters, or other mechanisms between the electrical source and the final mechanical output.
This distinction matters when comparing motors from different suppliers. Two datasheets may both report an efficiency of 85%, for example, while one value represents motor-only efficiency and the other includes the driver. Without knowing the measurement boundary, the percentages are not directly comparable.
Therefore, when you see an efficiency percentage, it's critical to ask:
- At what torque and speed was this measured?
- What was the input voltage and ambient temperature?
- Was the motor already thermally stabilized?
- Does the figure include the driver's power consumption?
An efficiency percentage without its operating point and measurement boundary is incomplete information.
Why Brushless Motor Efficiency Changes With Torque and Speed
A motor's efficiency is not a fixed property; it changes dynamically because different loss mechanisms dominate in different operating regions.
Efficiency is a surface over the torque–speed operating region, not one permanent property of the motor.
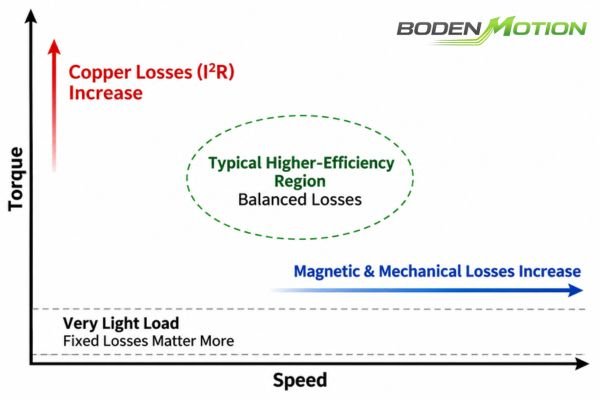
The important relationship is not that one region is universally “good” or “bad,” but that the balance between useful mechanical output and different loss mechanisms shifts as torque and speed change.
- Low Speed, High Torque: The high current demand to produce torque increases
I²Rcopper losses in the windings, which can cause efficiency to fall significantly. - High Speed, Low Torque: At high speeds, speed-dependent losses like bearing friction, windage (air resistance), and magnetic core losses can become more significant, reducing efficiency.
- Very Light Load: When mechanical output power is very low, the remaining speed-dependent and fixed losses (like bearing friction) become a larger percentage of the total input power, causing efficiency to drop.
- Intermediate Operating Region: Many motors reach their highest efficiency within an intermediate operating region where useful mechanical output is high enough while copper, magnetic, and mechanical losses remain manageable.1
Where Brushless Motor Losses Actually Come From
The shape of the efficiency map is determined by the interplay of different physical loss mechanisms. The relevant losses depend on the efficiency boundary being evaluated.
Motor-only efficiency includes winding, magnetic, and mechanical losses, while motor-drive efficiency also includes inverter conduction and switching losses.
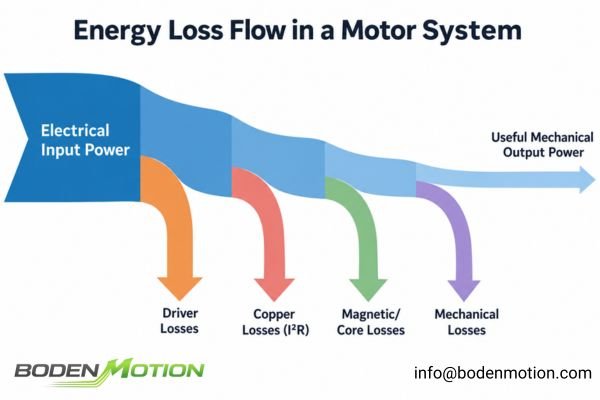
This distinction is especially important when efficiency data from different suppliers are compared, because two similar percentage values may not include the same loss sources.
| Loss Type | Mainly Influenced By | Often Significant At |
|---|---|---|
Copper Loss (I²R) |
Current, Winding Resistance | High Torque, High Current |
| Magnetic/Core Loss | Electrical Frequency, Flux Density | Higher Speed / Frequency |
| Mechanical Loss | Speed, Bearing Condition | Across the Range, esp. High Speed |
| Driver Conduction Loss | Current, MOSFET Rds(on) | High Torque/Current |
| Driver Switching Loss | Switching Frequency, Bus Voltage, Current | Depends on Drive Strategy and Operating Point |
It's also important to remember that winding resistance increases with temperature2, so the same current produces greater copper loss in a hotter winding.
How to Read a Brushless Motor Efficiency Map
An efficiency map is one of the most useful tools for this analysis. It shows contour lines of constant efficiency across the motor's operating range.
The useful question is where the application's actual torque-speed points fall relative to the motor's efficiency and operating-limit regions.
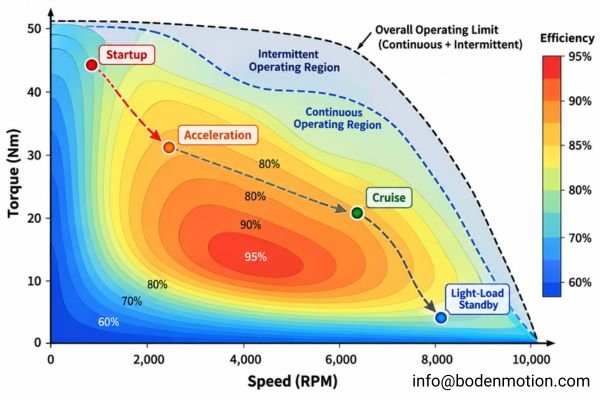
Rather than focusing on the single highest contour value, an OEM engineer should use the map to understand how frequently the application operates in each efficiency region and whether those points remain within allowable electrical and thermal limits.
- Identify Key Operating Points: Define the speed, torque, and duration for each major stage of your application's duty cycle.
- Plot Points on the Map: Find each (Speed, Torque) coordinate on the map.
- Note the Efficiency: Check the efficiency contour for each point.
- Verify Against Thermal Limits: Check whether the operating points fall within the motor's continuous or intermittent operating region. A high-efficiency point is not useful if the required operating duration exceeds the motor's thermal capability.
By plotting the entire cycle, you can see whether the application spends most of its time in a high-efficiency region or frequently operates in areas with greater losses3.
Why Duty-Cycle Efficiency Must Be Energy-Weighted
If an application has multiple operating stages, the efficiency percentages at those points cannot simply be averaged.
Cycle efficiency must reflect how much power is transferred and how long the motor remains at each operating point.
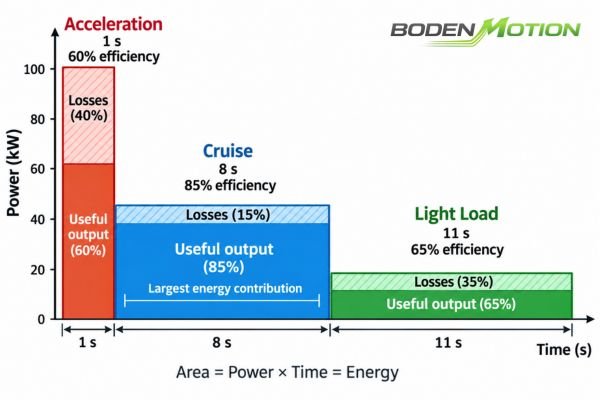
This is why a short low-efficiency stage can still contribute substantial energy loss when its power level is high, while a long light-load stage may consume relatively little total energy despite a lower percentage efficiency.
Consider this simplified duty cycle:
| Stage | Torque | Speed | Power Out | Efficiency | Duration |
|---|---|---|---|---|---|
| Acceleration | 20 mNm | 5k RPM | 10.5 W | 60% | 1s |
| Cruise | 5 mNm | 15k RPM | 7.9 W | 85% | 8s |
| Light Load | 1 mNm | 15k RPM | 1.6 W | 65% | 11s |
A simple average of (60% + 85% + 65%) / 3 ≈ 70% is incorrect. The correct approach compares total energy out to total energy in:
η_cycle = Σ(P_mech × t) / Σ(P_elec × t)4
- Total Mechanical Energy Output:
(10.5 W × 1 s) + (7.9 W × 8 s) + (1.6 W × 11 s) = 91.3 J
- Total Electrical Energy Input (since
P_elec = P_mech / η):((10.5 / 0.60) × 1) + ((7.9 / 0.85) × 8) + ((1.6 / 0.65) × 11) ≈ 118.9 J
- Energy-Weighted Cycle Efficiency:
η_cycle ≈ 91.3 J / 118.9 J ≈ 76.8%
The energy-weighted cycle efficiency is approximately 76.8%, not the 70% obtained by averaging the percentages. This energy-based value is far more useful for predicting battery runtime.
However, energy-weighted cycle efficiency does not by itself predict peak motor temperature. Thermal response also depends on the duration and frequency of loss pulses, cooling conditions, and the motor's thermal time constants. Short, high-loss events and continuous lower-loss operation can produce very different winding temperatures.
What OEM Engineers Should Provide for a Real Efficiency Evaluation
To move beyond a single-point comparison, suppliers need a complete description of the application's duty cycle.
Asking for an “85% efficient motor” is far less useful than defining the speed, torque, duration, electrical limits, and thermal conditions the motor must actually handle.
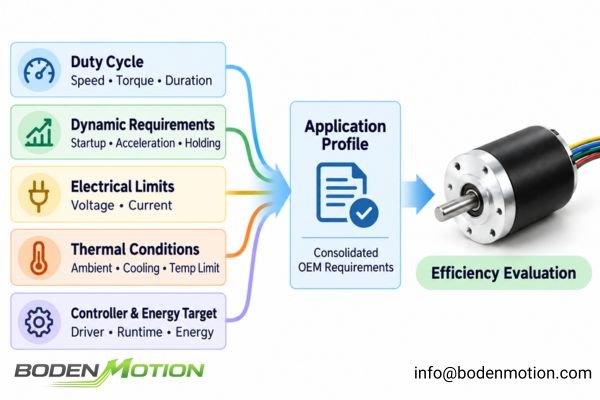
These inputs allow the motor supplier to evaluate the application as an operating profile rather than optimize around one nominal point5 that may represent only a small part of the real cycle.
For a thorough analysis, OEM engineers should provide:
- Speed, torque, and duration for each stage of the cycle.
- Startup frequency and acceleration/deceleration times.
- Holding torque requirements and duration.
- Supply voltage range and any current limits.
- Details of the driver/controller to be used.
- Ambient temperature and cooling conditions.
- Maximum allowable winding or housing temperature.
- Target battery runtime or allowable energy consumption.
A much more effective requirement sounds like this:
“Our application requires the motor to run at 12,000 RPM with 8 mN·m of torque for 70% of the cycle, accelerate with higher torque for 10%, and operate lightly loaded for the remaining 20%.”
How to Compare Two Brushless Motors Using the Same Duty Cycle
Before comparing two efficiency maps, confirm that they use compatible measurement boundaries and test conditions.
A motor-only map should not be compared directly with a motor-plus-driver map, and differences in bus voltage, temperature, controller strategy, or test method can shift the measured efficiency regions.
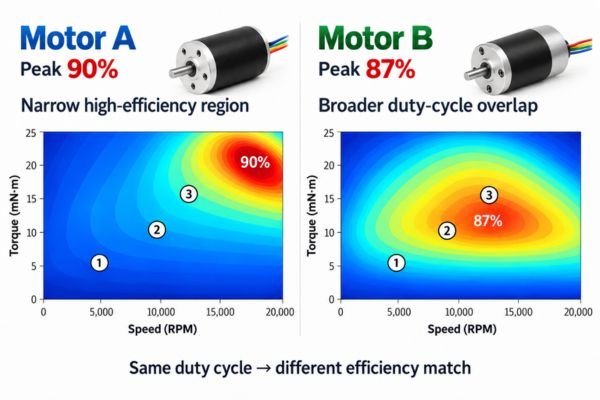
Once the data are comparable, the useful comparison is not which map contains the highest single efficiency value, but which motor provides the best overall match to the application's important operating points.
Consider two motors:
- Motor A: Peak efficiency of 90% at high speed.
- Motor B: Peak efficiency of 87%, but has a broader efficiency island at the application's primary operating points.
Choose the motor whose efficiency map best overlaps the application's operating map—not necessarily the motor with the highest single efficiency number. For customized OEM motors, winding selection can be evaluated against the application's dominant torque-speed region so that the motor is optimized around the actual duty cycle rather than a single nominal point.
| Selection Question | Better Metric to Use |
|---|---|
| Best Battery Runtime? | Lowest Total Cycle Energy Consumption |
| Lowest Winding Temperature? | Cycle Loss Profile + Transient Thermal Analysis |
| Handles High Load? | Efficiency at that specific Torque-Speed Point |
| Best for Light Load? | Efficiency in the Light-Load Region |
| Highest "Datasheet" Number? | Peak Efficiency (Often Misleading) |
| Best Overall Selection? | Duty-Cycle Weighted Performance & Thermal Analysis |
The motor-drive system with lower total input energy for the same mechanical work will generally provide better battery runtime.6 Motor winding temperature should still be evaluated from the motor's own loss distribution and thermal response.
Conclusion
A single peak-efficiency value describes only one operating point under specific test conditions. For OEM motor selection, efficiency should instead be evaluated across the application's actual torque, speed, duration, voltage, and thermal conditions.
The most meaningful comparison is not which motor has the highest published efficiency, but which motor-drive combination delivers the required duty cycle with the lowest practical energy consumption while remaining within its electrical and thermal limits. For application-specific evaluation, provide the operating profile—including speed, torque, duty cycle, supply voltage, and thermal requirements—so the motor can be assessed against the real system conditions.
FAQ
Q1: What does peak efficiency mean in a brushless motor?
Peak efficiency is the single highest measured efficiency value, which occurs at a specific combination of speed, torque, voltage, and temperature. It does not represent the motor's performance at other operating points.
Q2: Why is BLDC motor efficiency often lower at high torque?
For a given motor, higher torque generally requires higher current. Since copper losses increase with the square of the current (I²R), these losses often become dominant at high torque, significantly reducing efficiency.
Q3: Why can motor efficiency be low at very light loads?
At very light loads, the useful mechanical output power is small. However, fixed and speed-dependent losses (from bearings, magnetic effects, etc.) still exist. These losses become a large percentage of the input power, causing efficiency to drop.
Q4: What is a brushless motor efficiency map?
An efficiency map is a 2D plot that shows the motor's efficiency across a range of operating speeds and torques. It is a far more useful tool for motor selection than a single peak efficiency number.
Q5: How should OEM engineers compare the efficiency of two motors?
First, ensure the efficiency maps are comparable by checking the measurement boundary and relevant test conditions. Then, plot the application's duty cycle on each map and calculate the total energy consumed over the full cycle. The motor that uses less energy while remaining within its thermal and electrical limits provides the stronger efficiency match for that duty cycle.
Hsu et al. show that motor efficiency varies with load, with typical efficiency-versus-load curves remaining relatively high through an intermediate-to-high load region. The paper also separates motor losses into categories including stator and rotor copper loss, core loss, and friction and windage loss. ↩
Electrical resistance depends on material resistivity, conductor length, and cross-sectional area. Copper has a positive temperature coefficient of resistivity, so the resistance of a fixed-geometry copper winding increases as its temperature rises. ↩
Altair FluxMotor allows duty-cycle speed and torque working points to be plotted on efficiency and loss maps and evaluated over time, including efficiency, total losses, Joule losses, iron losses, and mechanical losses. ↩
The Texas A&M Turbomachinery Laboratory paper derives weighted efficiency from total output energy divided by total input energy across multiple operating points, with energy at each point calculated from power multiplied by operating time. ↩
KEB’s motor duty-cycle guidance describes motor selection in terms of the frequency and duration of operating states such as starting, loaded running, braking, speed or load changes, and rest rather than a single steady operating condition. ↩
The EV modeling study calculates traction energy from mechanical demand, drivetrain efficiency, and operating time over a driving cycle and tracks the resulting battery energy consumption and state of charge. ↩