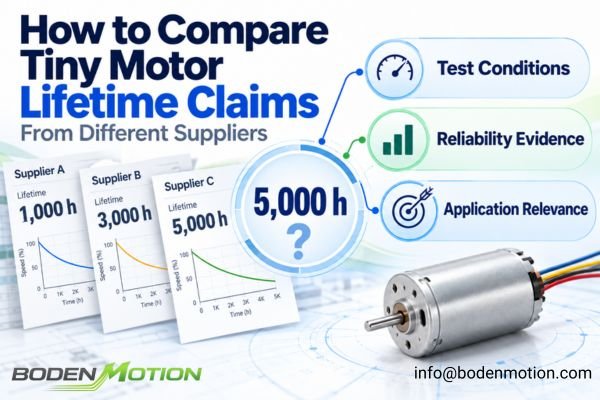
A lifetime number stated without a corresponding test profile is not a complete reliability claim. One tiny motor supplier may specify 1,000 hours, another 3,000 hours, and a third 5,000 hours. At first glance, the 5,000-hour motor appears to be the safest choice.
These lifetime numbers cannot be compared directly unless the underlying test conditions—load, speed, temperature, duty cycle, and failure criteria—are known and are reasonably equivalent. A longer reported lifetime is not automatically better if it was achieved under lighter conditions or with a looser definition of "failure."
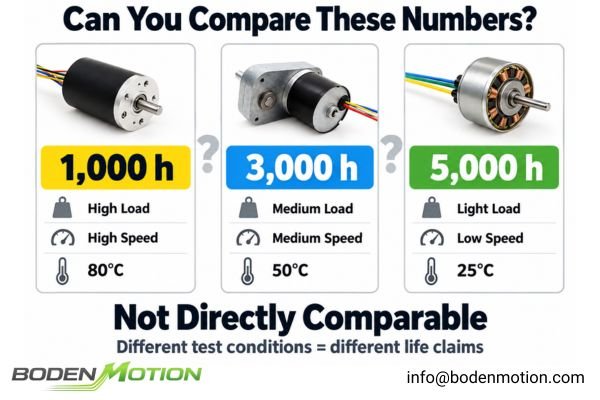
Motor life is not a fixed property; it depends on the operating conditions and stresses experienced throughout service.1 It is influenced by load torque, speed, current, temperature, and the frequency of starting or reversing. Furthermore, one supplier may define failure as the point when a motor can no longer start, while another may identify performance degradation, such as a drop in speed or an increase in current. The first engineering question should therefore be: what exactly does the supplier mean when they claim "5,000 hours"?
Why Motor Lifetime Cannot Be Compared by Hours Alone
Motor lifetime is a conditional parameter, highly dependent on the stresses it experiences during operation. A simple number of hours is only the beginning of the reliability story.
A lifetime value only becomes a meaningful engineering metric when it is attached to a specific operating profile. Comparing hours without aligning the test conditions is one of the most common mistakes in component selection.
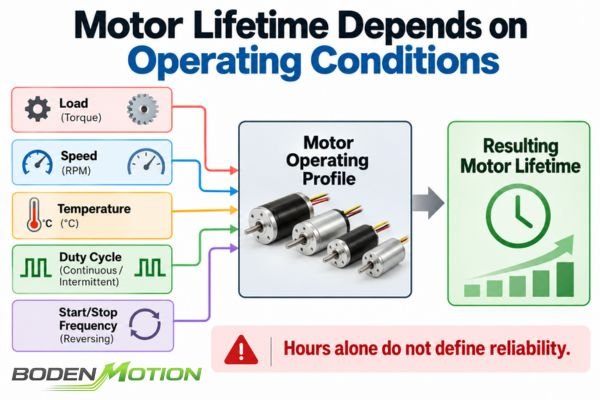
A motor that operates for 5,000 hours at a light load, moderate speed, and room temperature has not demonstrated the same reliability as a motor tested for 3,000 hours under higher torque, elevated temperature, and repeated starts. The key test variables that must be understood include:
- Supply voltage and motor speed
- Applied torque or load profile
- Operating current
- Ambient and motor body temperature
- Duty cycle (continuous vs. intermittent)
- Start-stop and direction-reversal frequency
- Driver settings and current control
- Radial and axial shaft loading
- Cooling conditions
For illustration, a vague claim of "Lifetime: 3,000 hours" is far less useful than a defined statement such as: "Estimated B10 Life: 3,000 hours at 12V, 5,000 rpm, 20 mNm torque, 40°C ambient, continuous duty, with failure defined as a greater than 15% drop in speed under specified reference conditions."
Even this more detailed statement requires supporting test data and a documented statistical method2 before the estimated B10 life can be evaluated.
What Does “Motor Failure” Mean in a Lifetime Test?
The definition of "failure" is one of the most critical and often overlooked variables in a lifetime test. A motor does not always transition instantly from "working" to "failed"; its performance may degrade gradually over time.
A longer reported lifetime does not automatically mean a more reliable motor if the end-of-life criterion is looser. A supplier using a stricter, more application-relevant failure definition may report a shorter life, but their data is often more useful for designing a reliable system.
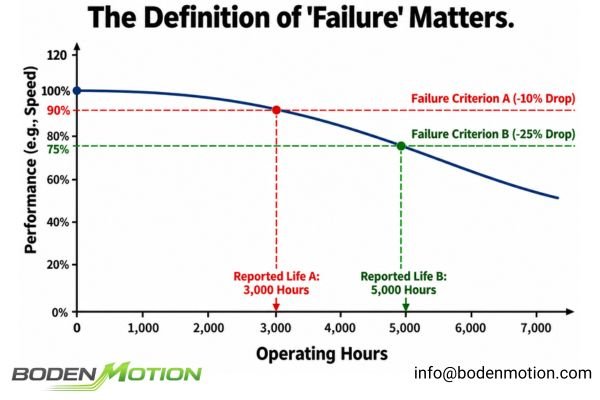
The end of a motor's useful life can be defined in many ways. It is crucial that any performance degradation, such as a speed drop or current increase, is measured under consistent, well-defined reference conditions of voltage, load, and temperature.
Possible end-of-life criteria include:
- Motor fails to start or stops unexpectedly during operation
- No-load speed falls below a defined limit (e.g., greater than 10% drop)
- No-load current rises above a defined acceptance limit
- Audible noise or vibration exceeds a specified threshold
- Bearing play exceeds the permitted tolerance
- A brush wear limit is reached
- Electrical insulation performance falls below an applicable acceptance limit
The percentage thresholds above are illustrative. Actual failure limits must be defined according to the motor design, test method, and application requirements. Electrical insulation criteria should only be included where they are relevant to the motor construction and applicable test procedure.
For illustrative purposes, consider this example: Supplier A defines failure as a complete inability to rotate. Supplier B defines failure as a 10% drop in speed. Even if they test identical motors under identical loads, Supplier B may report a shorter lifetime. However, Supplier B's data is more relevant for an OEM whose application cannot tolerate a 10% performance degradation.
B10 Life vs Mean Life vs Maximum Test Hours vs Design Life
The statistical term used to describe the lifetime number is just as important as the test conditions. A "5,000-hour" claim can have many different meanings, and they are not interchangeable.
“Tested for 5,000 hours” and “a 5,000-hour B10 life” are not the same statement. Understanding the statistical basis of a lifetime claim is essential for assessing risk.
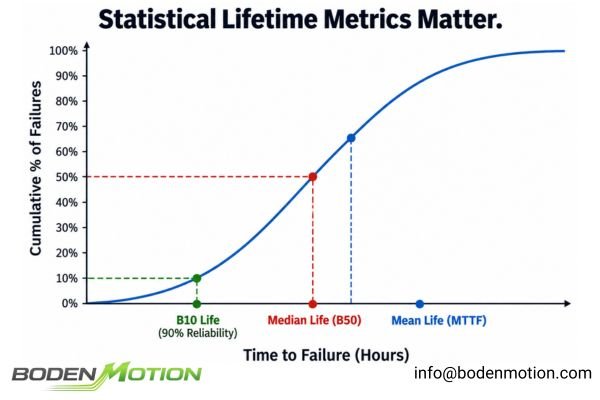
Engineers and procurement managers should be familiar with these common terms:
| Lifetime Term | What It Typically Means | Is It a Strong Comparison Metric? |
|---|---|---|
| B10 Life3 | The time at which 10% of the population is expected to have failed (i.e., 90% reliability). | Yes, if test conditions and statistical methods are comparable. |
| Mean Life (MTTF) | The average time to failure of the population, estimated from test data or a statistical model. | Useful, but dependent on the lifetime distribution and not interchangeable with B10 or median life. |
| Median Life (B50) | The time at which 50% of the population is expected to have failed. | Useful, but different from B10 and mean life. |
| Maximum Observed Life | The longest runtime achieved by a single unit in a test. | Poor. A single data point says little about population reliability. |
| Test Duration | How long the test was run, not a lifetime metric by itself. | No. It does not independently establish the lifetime distribution. |
| Design Life | An engineering target or goal for the product. | No. This is an objective, not a demonstrated result. |
| Warranty Period | A commercial commitment. | No. This is a business decision, not a physical lifetime. |
It's also important not to confuse a reliability figure (like the 90% survival probability corresponding to B10 life) with a statistical confidence level.
A confidence level, such as 90% confidence, describes a property of the statistical estimation procedure and is used when expressing uncertainty through confidence intervals or bounds. It is separate from the reliability level represented by B10.
How Load, Speed, Temperature, and Duty Cycle Change Motor Life
Lifetime is not a fixed property but an outcome of the physical stresses a motor endures. These stresses accelerate different wear mechanisms depending on the motor's construction.
A motor's lifetime should be evaluated against a complete load spectrum and environmental profile, as the relationship between stress factors and lifetime is often non-linear and specific to the motor's design.
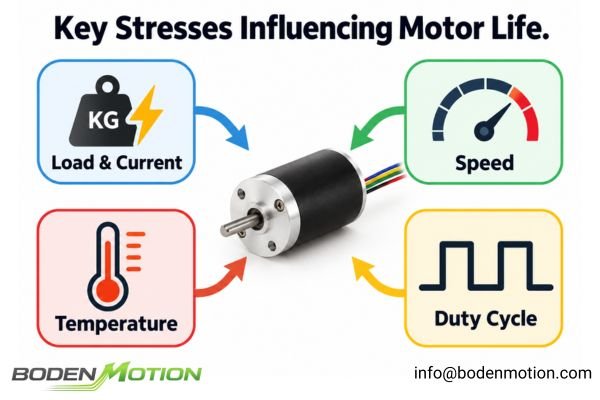
No single temperature- or load-based acceleration model applies universally to all miniature motors. However, several general effects are well understood:
- Load & Current: Higher load torque generally requires higher current, increasing winding temperature through I²R heating and potentially adding stress to the commutation system4.
- Speed: Higher RPM can accelerate bearing and brush-commutator wear, depending on the motor design and operating conditions.
- Temperature: Elevated temperatures can accelerate the degradation of lubricants, insulation, and adhesives.
- Duty Cycle: Frequent starts, stops, or direction reversals can introduce repeated current surges, thermal cycling, and mechanical stress.
- Driver Conditions: PWM settings, current limits, and startup control can influence electrical and thermal stress, particularly in brushed motor applications.
The dominant lifetime-limiting factor also depends on the motor technology. For coreless motors commonly used in precision applications, key differences include:
- Precious-Metal Brushed Motors: Lifetime can be limited by mechanical contact wear and electrical erosion at the brush-commutator interface. Operating current, current ripple, speed, and frequent starting or reversing may influence these wear mechanisms.
- Carbon-Brushed Motors: Brush and commutator wear remain important life-limiting factors. Both mechanical wear and electrical effects can contribute, with durability influenced by operating current, speed, load, and duty cycle.
- Brushless Motors (BLDC): With no contacting brushes, brush-commutator wear is eliminated. Bearing wear, lubrication, temperature, mechanical loading, and vibration are often important lifetime considerations.
These distinctions do not mean that one motor technology always lasts longer than another. They indicate that different motor constructions may have different dominant failure mechanisms.
Therefore, when comparing lifetime claims, OEM engineers should determine whether the supplier's endurance test adequately represents the wear mechanisms and operating stresses relevant to the selected motor technology.
Why Sample Size and Statistical Confidence Matter
A lifetime test result is only as meaningful as the evidence that backs it up. A test on a single motor provides very different information than a structured reliability test on a larger population.
The amount of evidence required should increase with the application's risk, required lifetime, and production volume. A single data point provides limited reliability information, while a properly designed population test can support statistical analysis.
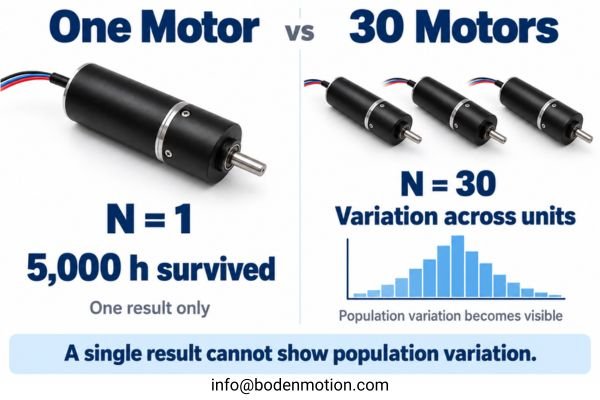
For illustrative purposes, compare two hypothetical claims:
- Supplier A: One motor was tested and completed 5,000 hours with no failure.
- Supplier B: Thirty motors were tested under documented conditions. Based on the recorded failure and survival data and a stated statistical model, an estimated B10 life of 2,800 hours was calculated.
Supplier B has provided more information for a statistical reliability assessment, even though its reported B10 value is numerically lower. However, the strength of that estimate still depends on the number and timing of observed failures, the assumptions of the selected model, and the uncertainty of the result.
This does not establish that Supplier B's motor has a longer or shorter service life than Supplier A's motor. The two claims describe different types of evidence and cannot be ranked directly by their headline hour values.
When evaluating lifetime data, it's also important to understand right-censored data. This term describes units for which failure has not been observed by the end of their recorded observation period, including when a test is stopped while the units are still functioning. These records provide valuable information—that the units survived at least as long as their observed operating time—and are important inputs for proper statistical lifetime analysis, such as Weibull analysis5.
A supplier should therefore report not only how many samples were tested, but also the observed failure times, survival times, and statistical methods used to interpret the results.
What OEM Buyers Should Request From a Supplier's Lifetime Report
To make an informed decision, engineers and procurement teams must move beyond asking "What is the lifetime?" and start requesting the underlying test definition and data.
The goal is to shift the conversation from a vague guarantee to a technical discussion about reliability evidence. Request the full test report or, at a minimum, the complete test protocol, results summary, and failure criteria.
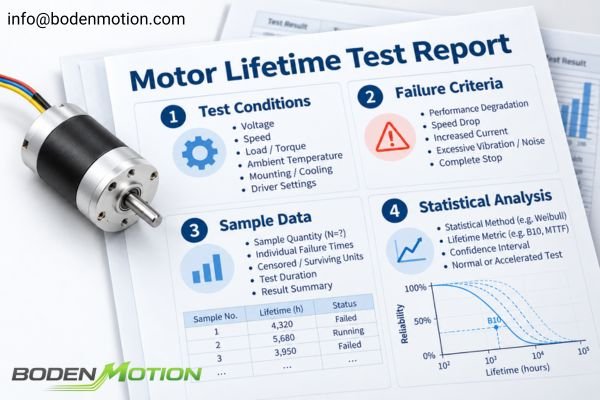
A professional inquiry for lifetime data should request access to a report containing:
- Motor model, revision, and sample quantity
- Complete test conditions: voltage, speed, load/torque, ambient temperature, and mounting/cooling
- Driver and control conditions, including PWM settings and current limits where applicable
- Duty cycle details: continuous run, start-stop frequency, direction-reversal frequency
- Test duration and the final status of all samples, including individual failure times and censored/surviving units
- The specific, measurable definition of "failure" used in the test
- The statistical method used for analysis (e.g., Weibull) and the resulting lifetime metric (e.g., B10, MTTF)
- Confidence intervals or confidence bounds, when statistical estimates are reported
- Whether the test was conducted under normal or accelerated conditions, including any acceleration model and assumptions used
For a broader framework on engineering sample documentation, see what test data a DC motor supplier should provide with samples.
How to Normalize and Compare Lifetime Claims
After receiving data from different suppliers, OEM engineers must determine whether the reported lifetime values are based on comparable operating conditions and reliability evidence. The goal is not simply to collect more specifications, but to understand which differences may affect the final supplier decision.
The first step is to align the test conditions and evaluate the available evidence. Converting lifetime results from one operating condition to another requires a validated life model for the relevant motor and failure mechanism. Without such a model, different lifetime claims cannot be reliably converted to a common operating profile.
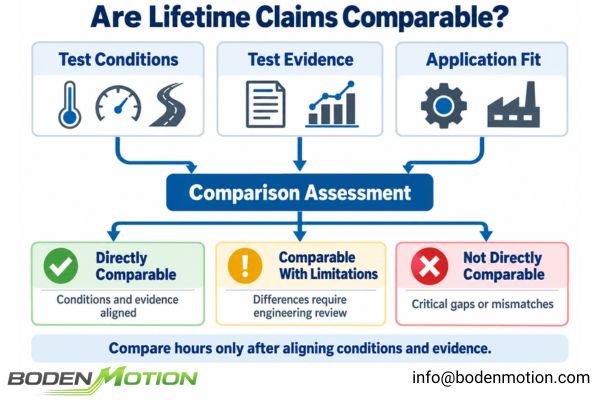
The following criteria help identify whether supplier lifetime claims are directly comparable.
| Evaluation Area | What to Check | Why It Matters |
|---|---|---|
| Lifetime Definition | B10, MTTF, maximum observed life, or completed test hours | Different lifetime metrics cannot be compared as equivalent values. |
| Operating Conditions | Voltage, speed, load torque, current, and driver settings | Different operating stresses may produce different wear rates. |
| Environment & Duty Cycle | Temperature, cooling, continuous/intermittent operation, starts and reversals | Laboratory conditions may not represent the actual OEM application. |
| Failure Criteria | Speed degradation, current increase, brush wear, or complete failure | Different end-of-life definitions can produce different reported lifetimes. |
| Test Evidence | Sample quantity, failure times, surviving units, and statistical confidence information | Determines how strongly the available data supports the lifetime estimate. |
| Testing Method | Normal endurance testing or accelerated testing with a validated acceleration model | Accelerated results cannot automatically be treated as equivalent real operating hours.6 |
| Application Relevance | Whether the test profile represents the intended operating conditions and critical stresses | Even statistically strong data may have limited value for a different application. |
Interpreting the Comparison Results
After reviewing these factors, the available lifetime claims generally fall into three practical categories:
-
Directly Comparable: Test conditions, failure definitions, lifetime metrics, and supporting evidence are sufficiently aligned. Engineers can compare the reported results while considering statistical uncertainty.
-
Comparable With Limitations: Some differences exist, but their effects and uncertainties can be assessed. Additional engineering review or targeted testing may be required before making a decision.
-
Not Directly Comparable: Critical test conditions, lifetime definitions, or statistical evidence are inconsistent or missing. The appropriate next step is to request additional information or conduct application-specific validation.
These categories are practical engineering judgments rather than formal reliability certification levels.
Importantly, evidence quality and application relevance should be evaluated separately. A large statistical test may provide strong evidence about a motor population but may not represent the intended OEM duty cycle7. Conversely, a small application-specific test may closely match actual operating conditions while providing limited statistical precision8.
The objective is not to identify the supplier with the largest lifetime number, but to determine which supplier provides sufficiently credible and relevant evidence for the application's service-life requirements.
Conclusion
A tiny motor's lifetime cannot be meaningfully compared using headline hours alone. A "5,000-hour" claim may represent a single unit completing an endurance test or a statistically estimated B10 life for a motor population—two very different forms of evidence. OEM engineers should examine operating conditions, failure criteria, sample results, and statistical methods to determine whether supplier lifetime claims are comparable and relevant to their applications.
The goal is not to select the supplier with the highest stated lifetime, but to identify the motor supported by credible, application-relevant reliability evidence. At BODENMOTION, we help OEM teams evaluate motor suitability against actual operating conditions and service-life targets. Explore our coreless motors or contact our engineering team at info@bodenmotion.com for a technical consultation.
FAQ
Q1: Is a 5,000-hour motor always better than a 3,000-hour motor?
Not necessarily. The claims are only comparable if the load, speed, temperature, duty cycle, failure criteria, and the statistical basis for the claim (e.g., B10 vs. maximum observed time) are sufficiently similar.
Q2: What is B10 motor life?
B10 life is a reliability metric representing the time at which 10% of a motor population is expected to have failed under a specific set of operating conditions. It corresponds to a reliability of 90% and is distinct from the statistical confidence level of the estimate.
Q3: Is “tested for 5,000 hours” the same as “5,000-hour lifetime”?
No. A test duration only establishes how long the test was conducted and the observed performance or survival of the tested samples. It does not, by itself, define the lifetime distribution, such as B10 or mean life, for the entire motor population.
Q4: How many samples are needed for a motor lifetime test?
There is no universal number. The appropriate sample size depends on the desired statistical confidence, target reliability, test duration, expected failure behavior, and overall application risk. Stronger statistical evidence generally requires more relevant test information, which may involve additional samples, longer observation periods, or both.
Q5: What should OEM buyers request before accepting a motor lifetime claim?
Request the full test report or protocol. It should specify the test load, speed, temperature, duty cycle, sample quantity, the specific definition of failure, data on all failed and surviving units, and the lifetime metric (e.g., B10) and statistical method used.
“Reliability Life Testing and Evaluation of 3-Phase Motors,” presented at Purdue University's International Compressor Engineering Conference, explains that motor failure behavior depends on the relationship between applied operating stresses and motor design strength. It emphasizes that different test conditions can produce different reliability results, making consistent stress conditions essential when comparing motor lifetime data. ↩
“Reliability Life Testing and Evaluation of 3-Phase Motors” demonstrates how recorded motor failure times, suspended test data, defined failure criteria, and Weibull statistical analysis are used to estimate and compare motor reliability characteristics. ↩
Portescap's “Reliability Estimation of Coreless Brush DC Motors” defines B10 life as the time at which 10% of a motor population is expected to have failed, corresponding to 90% reliability, and demonstrates its estimation through Weibull analysis. ↩
FAULHABER Group's “Motor Calculations” explains the proportional relationship between motor torque and armature current in small coreless DC motors and demonstrates how winding-current losses (I²R) contribute to motor temperature rise. ↩
“Estimation of Conditional Mixture Weibull Distribution with Right Censored Data Using Neural Network for Time-to-Event Analysis” demonstrates how right-censored observations can be incorporated into Weibull-based survival analysis to estimate lifetime distribution parameters. ↩
The NIST/SEMATECH Engineering Statistics Handbook's “What Are Some Common Acceleration Models?” explains that converting accelerated test results into predicted service life requires an appropriate stress–life relationship and an acceleration model based on the relevant failure mechanism. ↩
Dennis Craggs' “Reliability Test Validation and Product Verification,” published by Accendo Reliability, demonstrates how statistical reliability targets and sample sizes must be combined with application-specific duty-cycle data. The case study shows why reliability testing should reflect actual customer usage rather than relying solely on established test-cycle targets. ↩
Shishir Rao's “How to Calculate Sample Size for Reliability Life Testing: A Step-by-Step Guide” explains how sample size and test duration affect the precision of lifetime estimates. Using a hypothetical life test under conditions similar to actual use, it demonstrates that insufficient test information can produce wide confidence intervals, even when a specified confidence level is maintained. ↩